
背景
按上篇文章《Traefik 2 群晖硬核指南》,文章阐述了容器时代下如何替代Nginx,搭建一个基于Traefik 2,搭建自动SSL、容器自动服务注册、自动域名解析的统一网关,网关是搭建好了,我们还需要做服务监控,才能做到心中有数,有据可查。
本文以上篇文章为范本,再次全流程的介绍如何搭建Traefik、Grafana、Prometheus、Promtail、Loki,并且如何配置服务,实现自动化日志记录、监控。
效果图
二话不说,咱们先看效果吧。
Traefik
按上篇文章,我们已经搭建了Traefik,但为了配合监控,我们需要对docker-compose.yml进行改造,因此,本文从头到尾的写一遍,您只需要看这一篇文章就够了,部分内容可能描述不够详细,有疑惑请到上一篇文章阅读。
cd /volume1/docker/
mkdir traefik
cd traefik
mkdir config
mkdir ssl
# 创建traefik专属网络
docker network create traefik
亮出我们的利器,通过docker-compose启动,编辑刚刚创建的yml文件 docker-compose.yml:
version: '3.7'

services:

  traefik:
    container_name: traefik
    environment:
      - CF_API_EMAIL=CLOUDFLARE邮箱
      - CLOUDFLARE_DNS_API_TOKEN=CLOUDFLARE API TOKEN
      - CLOUDFLARE_ZONE_API_TOKEN=CLOUDFLARE API TOKEN
    image: traefik:v2.1.3
    restart: always
    ports:
      - target: 52080
        published: 52080
        mode: host
      - target: 52443
        published: 52443
        mode: host
      - target: 52022
        published: 52022
        mode: host
      - "8080:8080"
    command: traefik --configFile /etc/traefik.yml
    volumes:
      - /var/run/docker.sock:/var/run/docker.sock:ro
      - ./ssl/:/data/ssl/:rw
      - ./traefik.yml:/etc/traefik.yml:ro
      - ./config/:/etc/traefik/config/:ro
      - ./logs/:/data/logs/:rw
    healthcheck:
      test: ["CMD-SHELL", "wget -q --spider --proxy off localhost:8080/ping || exit 1"]
      interval: 6h
    network_mode: host
在根目录下新建文件traefik.yml,写入如下配置内容。
global:
  checkNewVersion: false
  sendAnonymousUsage: false

log:
  level: "WARN"
  format: "common"
  filePath: "/data/logs/traefik.log"

api:
  dashboard: true
  insecure: true

ping: {}

accessLog:
  filePath: "/data/logs/access.log"
  bufferingSize: 100
  format: json
  filters:
    minDuration: "10ms"

providers:
  docker:
    watch: true
    exposedByDefault: false
    endpoint: "unix:///var/run/docker.sock"
    swarmMode: false
    useBindPortIP: false
    network: "traefik"
  file:
    watch: true
    directory: "/etc/traefik/config"
    debugLogGeneratedTemplate: true

entryPoints:
  http:
    address: ":52080"
    forwardedHeaders:
      insecure: true
  https:
    address: ":52443"
    forwardedHeaders:
      insecure: true
  ssh:
    address: ":52022"
    forwardedHeaders:
      insecure: true

certificatesResolvers:
  my:
    acme:
      email: "CLOUDFLARE邮箱"
      storage: "/data/ssl/acme.json"
      dnsChallenge:
        resolvers: ["1.1.1.1:53", "8.8.8.8:53"]
        provider: "cloudflare"
        delayBeforeCheck: 30
metrics:
  prometheus:
    buckets:
      - 0.1
      - 0.3
      - 1.2
      - 5.0
值得注意的是,因为运营商屏蔽了22、443、80端口,于是我使用52022、52443、52080做映射替代,如未被屏蔽,请忽略。
为了自动申请SSL证书,提交成功率,我才用DNS Challenge的方式校验有效性,因此需Cloudflare的环境信息,如果你的域名没有配置Cloudflare解析,可以根据这篇文章置换相应变量。
随后,进入config目录。
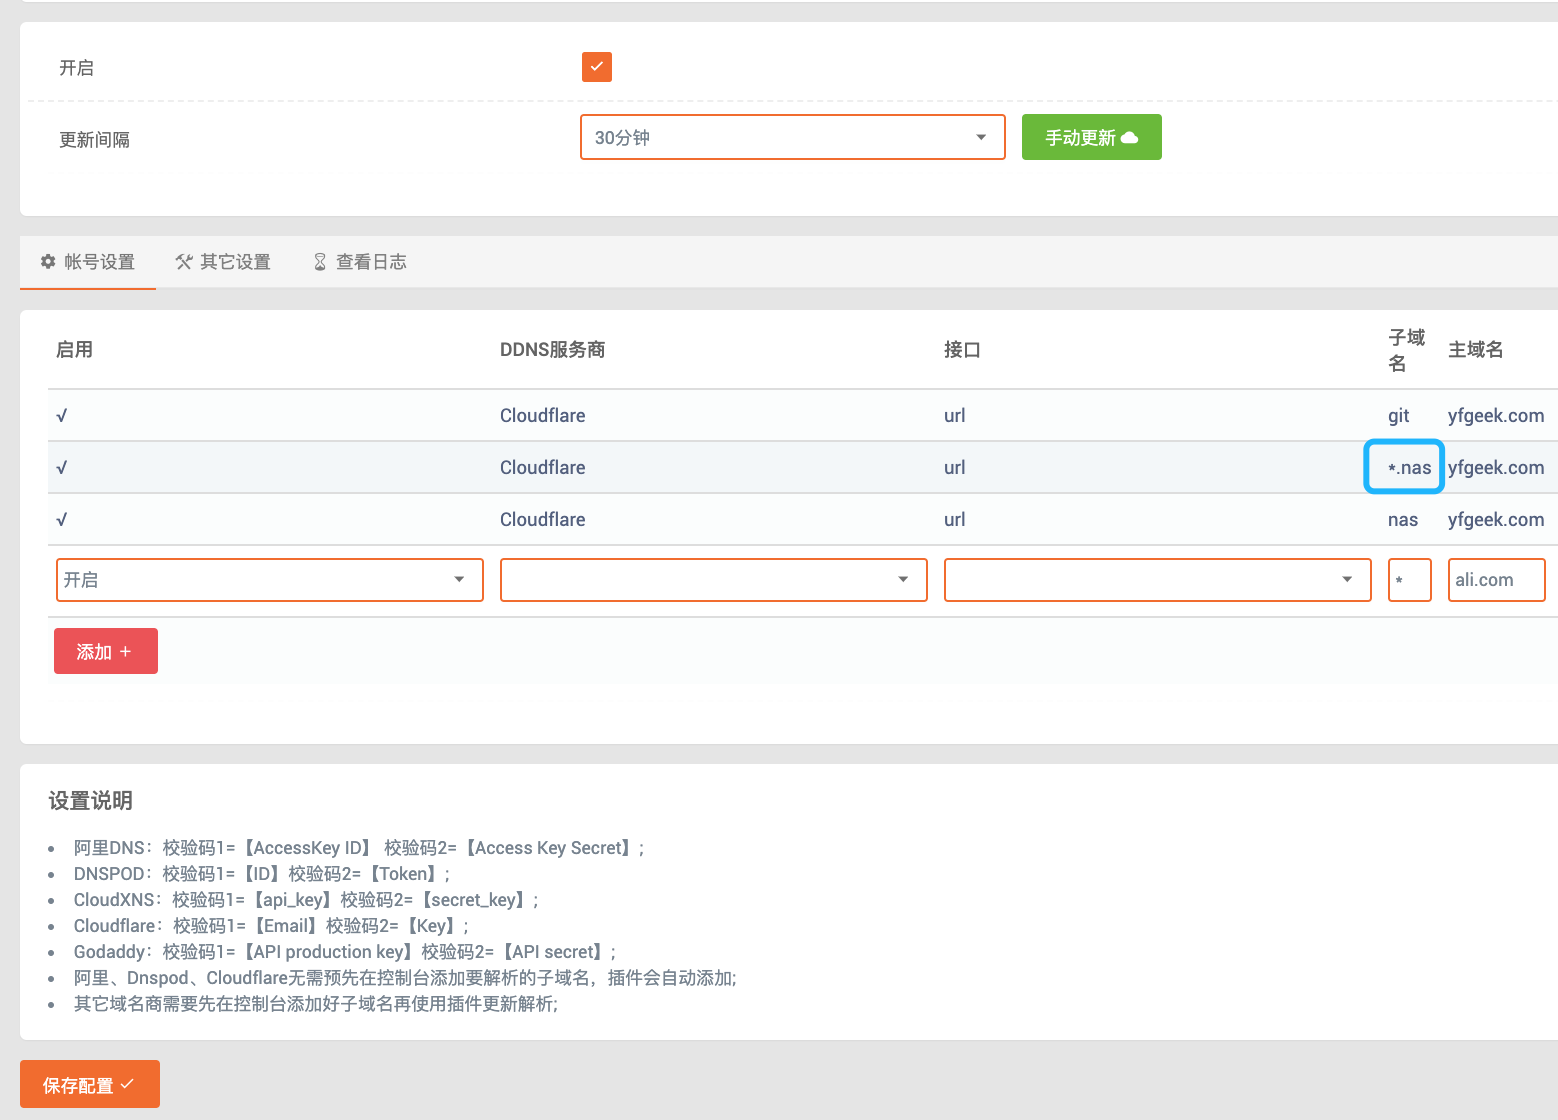
创建dashboard.nas.yfgeek.com.toml文件,作为traefik展示面板的配置文件,因为相对固化,所以采用文件配置文件的形式,traefik支持文件加载配置。
[http.middlewares.dash-compress.compress]
[http.middlewares.dash-auth.basicAuth]
  users = [
    "test:$apr1$ux2tmr06$Qz5r/BNEfzdxriR/0o30Z1",
  ]

[http.routers.dashboard]
  rule = "Host(`dashboard.nas.yfgeek.com`)"
  entrypoints = ["http"]
  service = "dashboard@internal"
  middlewares = ["dash-auth", "dash-compress"]

[http.routers.api]
  rule = "Host(`dashboard.nas.yfgeek.com`) && PathPrefix(`/api`)"
  entrypoints = ["http"]
  service = "api@internal"
  middlewares = ["dash-auth", "dash-compress"]

[http.routers.ping]
  rule = "Host(`dashboard.nas.yfgeek.com`) && PathPrefix(`/ping`)"
  entrypoints = ["http"]
  service = "ping@internal"
  middlewares = ["dash-auth", "dash-compress"]
这个文件中,我们设置了一个用于验证的中间件,进入网站之前会默认进行验证,密码是htpasswd生成规则,例子中用户名是test,密码是test,如需定制,可到这个网站生成密码。
全部创建好后,目录结构如下:
|____config
| |____dashboard.nas.yfgeek.com.toml
|____ssl
|____docker-compose.yml
|____traefik.yml
确认无误,我们使用启动大法,执行如下命令。
docker-compose up -d
docker container logs traefik -f
不出意外,服务即将启动成功,可以看到日志,如果有问题就见招拆招即可。
具体可参考:https://github.com/yfgeek/traefik-docker-compose/tree/master/traefik
搭建监控系统
监控系统,你可能跟我说ELK?别试了,我已经试过了,这个对内存要求太高了,群晖咱承受不起,最终采用的方案如下:
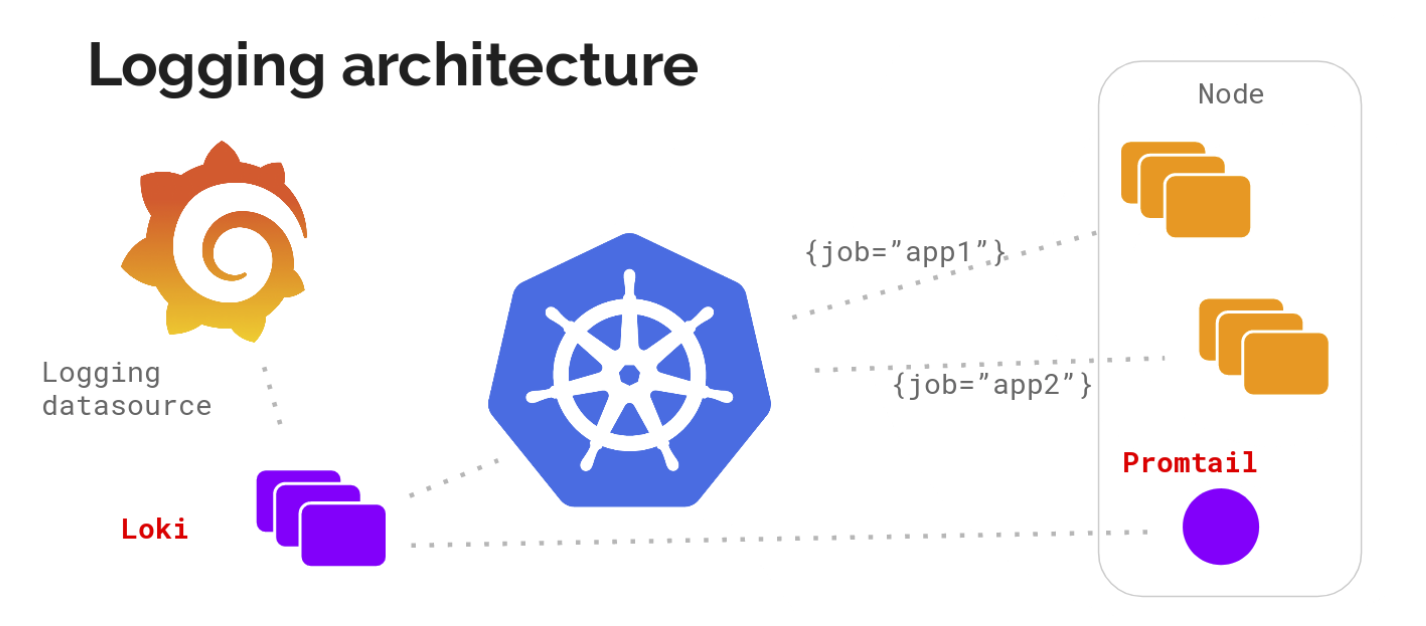
Grafana
Grafana 是一个用于监控和可视化观测的开源平台,支持非常丰富的数据源,在 Loki 技术栈中它专门用来展示来自 Prometheus 和 Loki 等数据源的时间序列数据。此外,还允许我们进行查询、可视化、报警等操作,可以用于创建、探索和共享数据 Dashboard,鼓励数据驱动的文化。
Prometheus
Prometheus受启发于Google的Brogmon监控系统(相似的Kubernetes是从Google的Brog系统演变而来),是一个开放性的监控解决方案,用户可以非常方便的安装和使用Prometheus并且能够非常方便的对其进行扩展。基于全新存储层的2.0版本,能更好地与容器平台、云平台配合。
Promtail
Promtail 是用来将容器日志发送到 Loki 或者 Grafana 服务上的日志收集工具,该工具主要包括发现采集目标以及给日志流添加上 Label 标签,然后发送给 Loki,另外 Promtail 的服务发现是基于 Prometheus 的服务发现机制实现的。
Loki
Loki 是一个受 Prometheus 启发的可以水平扩展、高可用以及支持多租户的日志聚合系统,使用了和 Prometheus 相同的服务发现机制,将标签添加到日志流中而不是构建全文索引。正因为如此,从 Promtail 接收到的日志和应用的 metrics 指标就具有相同的标签集。所以,它不仅提供了更好的日志和指标之间的上下文切换,还避免了对日志进行全文索引。
开搞
cd /volume1/docker/
mkdir monitoring
拷贝如下目录的全部文件:https://github.com/yfgeek/traefik-docker-compose/tree/master/monitoring
编辑docker-compose.yml文件,更改granafa的host地址,可更改为内网。
version: '3.7'

services:
  prometheus:
    image: prom/prometheus
    volumes:
      - ./prometheus/:/etc/prometheus/
      - prometheus_data:/prometheus
    command:
      - '--config.file=/etc/prometheus/prometheus.yml'
      - '--storage.tsdb.path=/prometheus'
      - '--web.console.libraries=/usr/share/prometheus/console_libraries'
      - '--web.console.templates=/usr/share/prometheus/consoles'
    networks:
      - inbound
    labels:
       - "traefik.enable=true"
       - "traefik.http.routers.prometheus.rule=Host(`prometheus`)"
       - "traefik.http.routers.prometheus.entrypoints=http"
       - "traefik.http.routers.prometheus.service=prometheus"
       - "traefik.http.services.prometheus.loadbalancer.server.port=9090"
       - "traefik.docker.network=inbound"

  grafana:
    image: grafana/grafana
    depends_on:
      - prometheus
    volumes:
      - grafana_data:/var/lib/grafana
      - ./grafana/provisioning/:/etc/grafana/provisioning/
    env_file:
      - ./grafana/config.monitoring
    networks:
      - inbound
    user: "472"
    labels:
        - "traefik.enable=true"
        - "traefik.http.routers.grafana.rule=Host(`grf.nas.yfgeek.com`,`grafana`)"
        - "traefik.http.routers.grafana.entrypoints=http"
        - "traefik.http.routers.grafana.service=grafana"
        - "traefik.http.services.grafana.loadbalancer.server.port=3000"
        - "traefik.docker.network=inbound"

  loki:
    image: grafana/loki
    expose:
      - "3100"
    volumes:
      - /volume1/docker/prometheus/loki/local-config.yaml:/etc/loki/local-config.yaml
      - loki_data:/loki
    command: -config.file=/etc/loki/local-config.yaml
    networks:
      - inbound

  promtail:
    image: grafana/promtail
    depends_on:
      - loki
    volumes:
      - /volume1/docker/traefik/logs:/var/log
      - /volume1/docker/prometheus/promtail/config.yml:/etc/promtail/config.yml
    command: -config.file=/etc/promtail/config.yml
    networks:
      - inbound


networks:
  inbound:
    name: inbound

volumes:
    prometheus_data: {}
    grafana_data: {}
    loki_data: {}
确认无误后,执行大法。
docker-compose up -d
等待docker都拉取完毕,创建好容器后,我们便可以通过访问设置的host地址,进入granafa登陆界面。
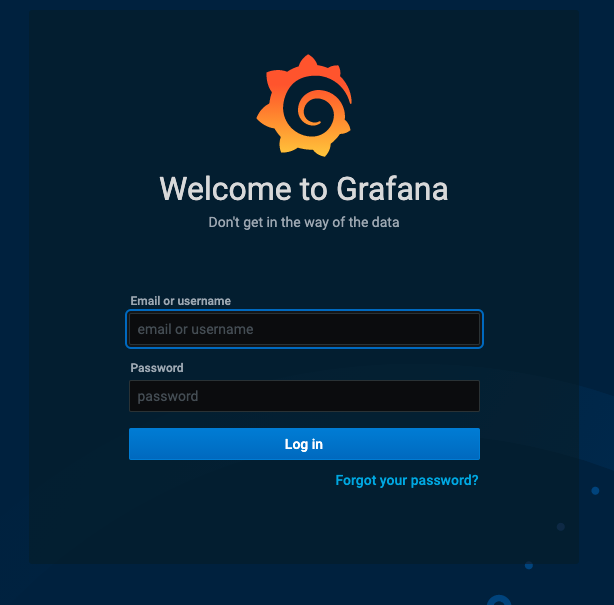
输入用户名admin 密码admin (密码后续可改),进入监控页面,点击如图所示的按钮,随后点击Add data source,添加数据源。
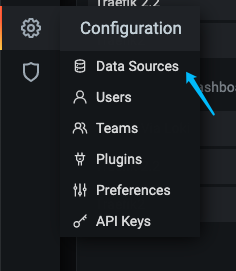
依次添加prometheus、loki

具体配置如下
prometheus地址:http://prometheus:9090
loki地址:http://loki:3100
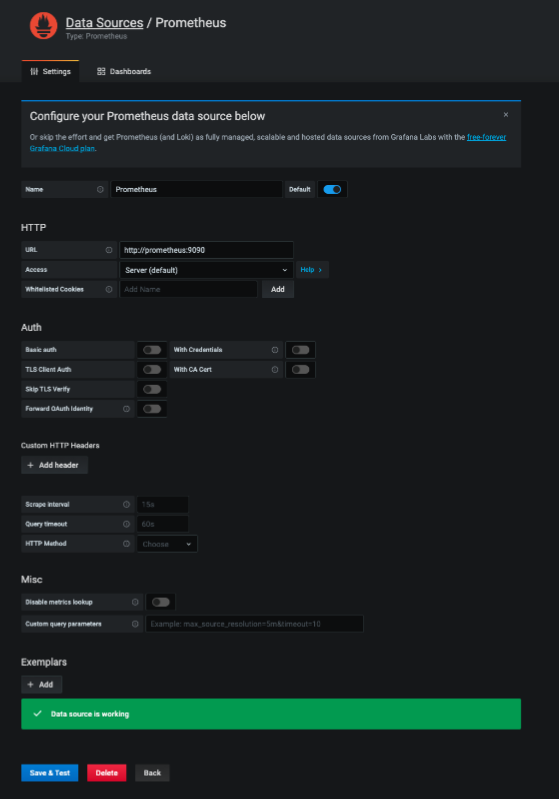
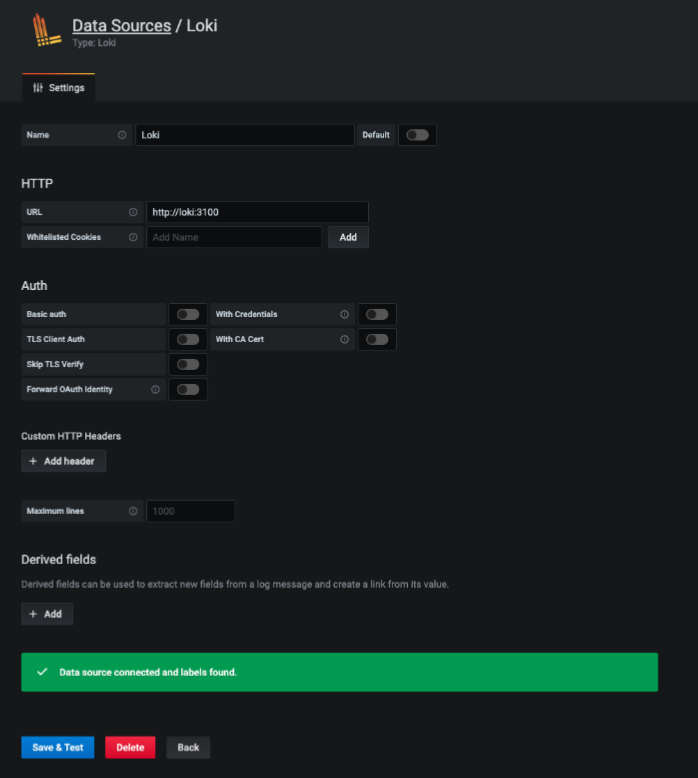
设置完成后,点击Save & Test 看到绿色成功,即设置成功。
日志检索
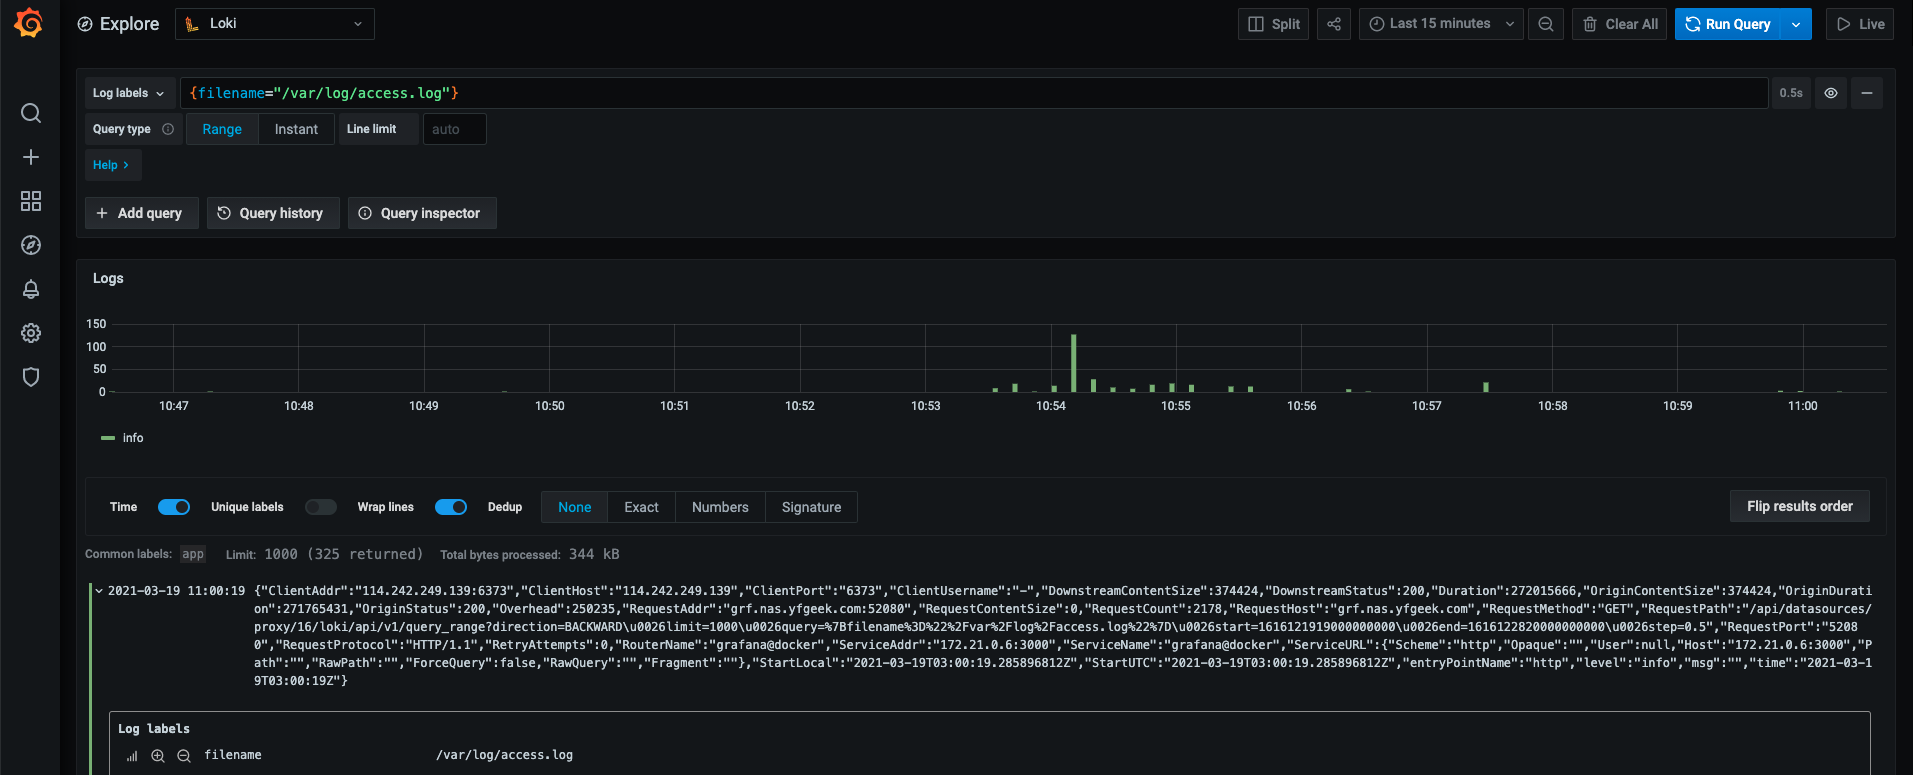
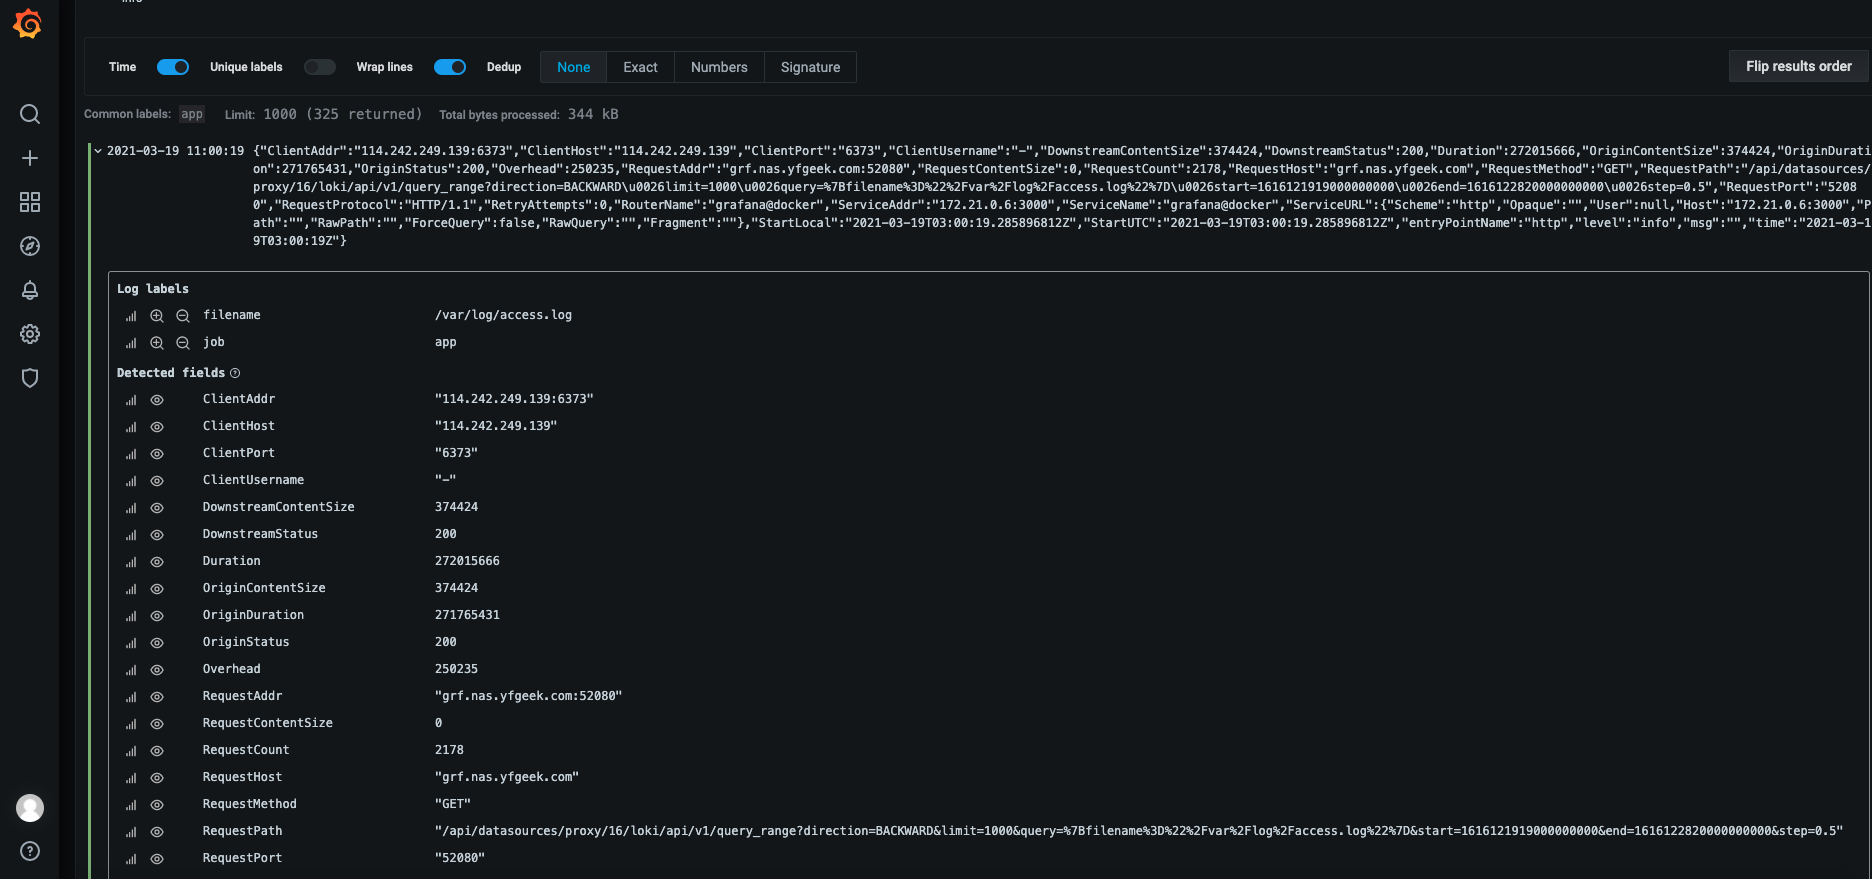
数据源添加完毕后,可以到Explore页面中,检查日志是否上送。
!grf6.png)
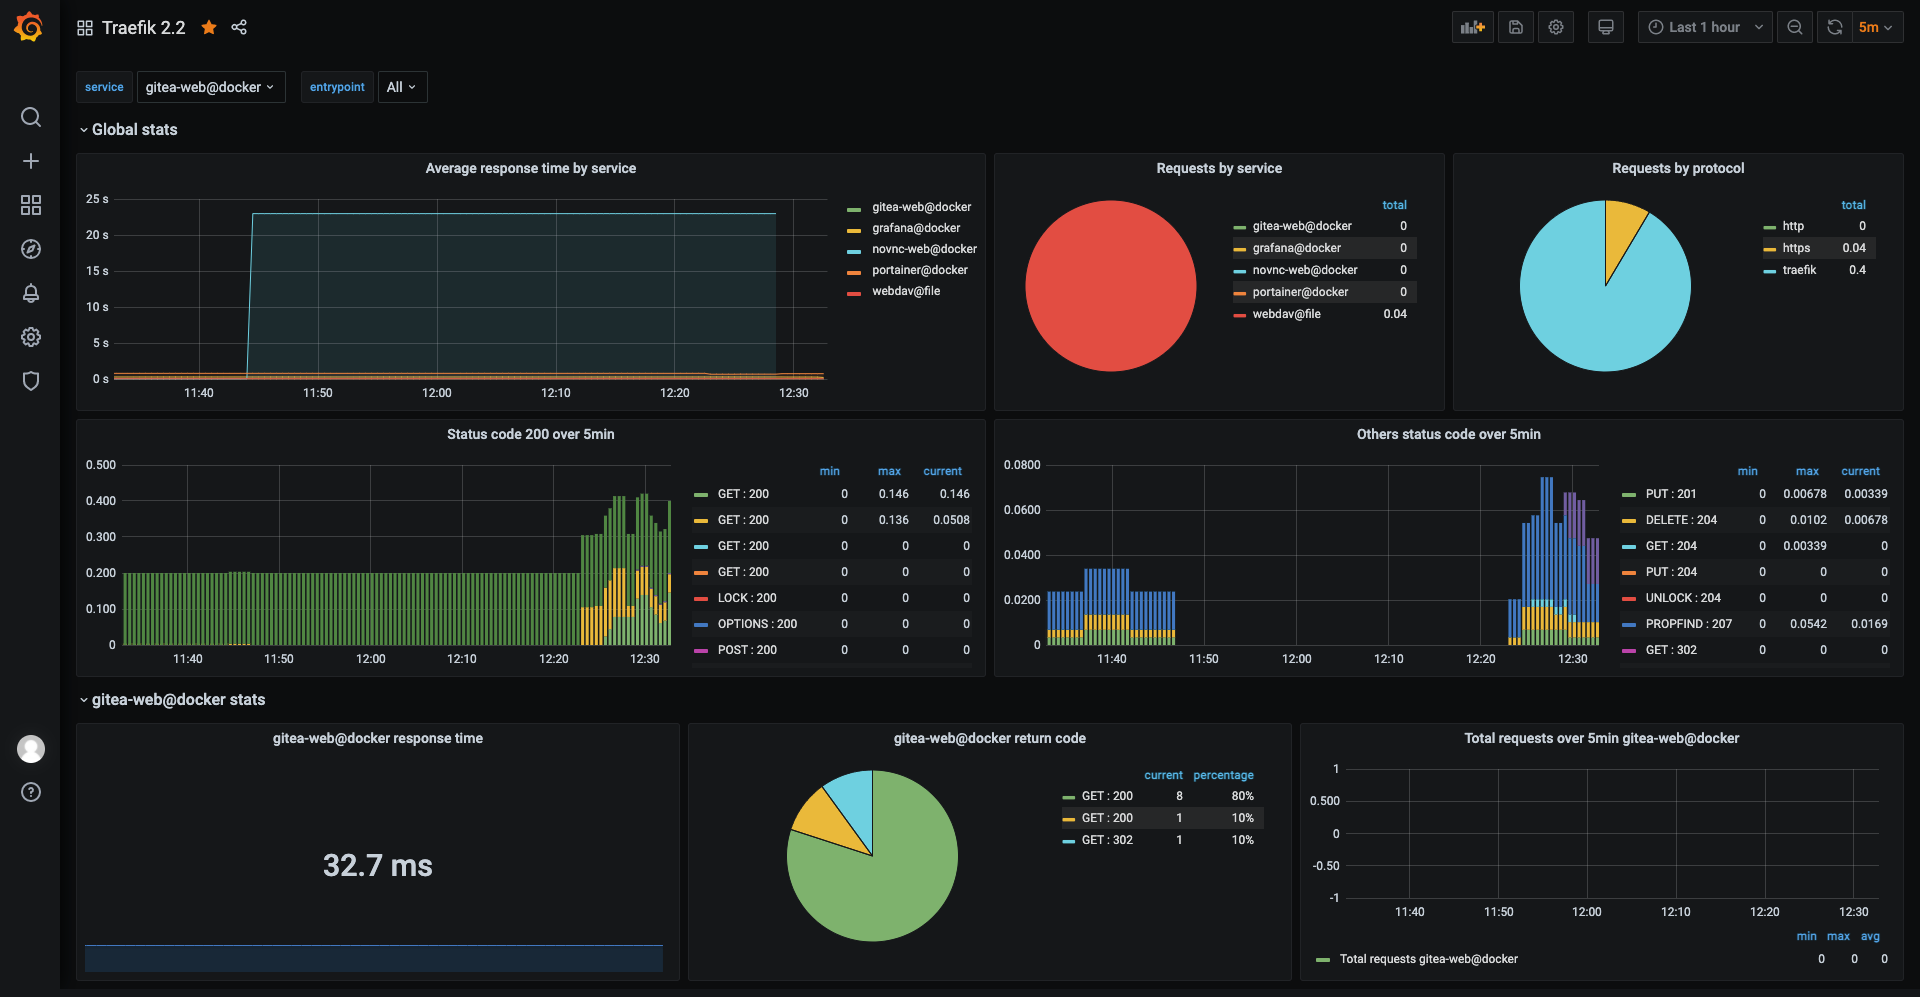
Traefik 大盘
点击加号按钮,点击Import,通过如下ID导入 12250,随后Import即可。
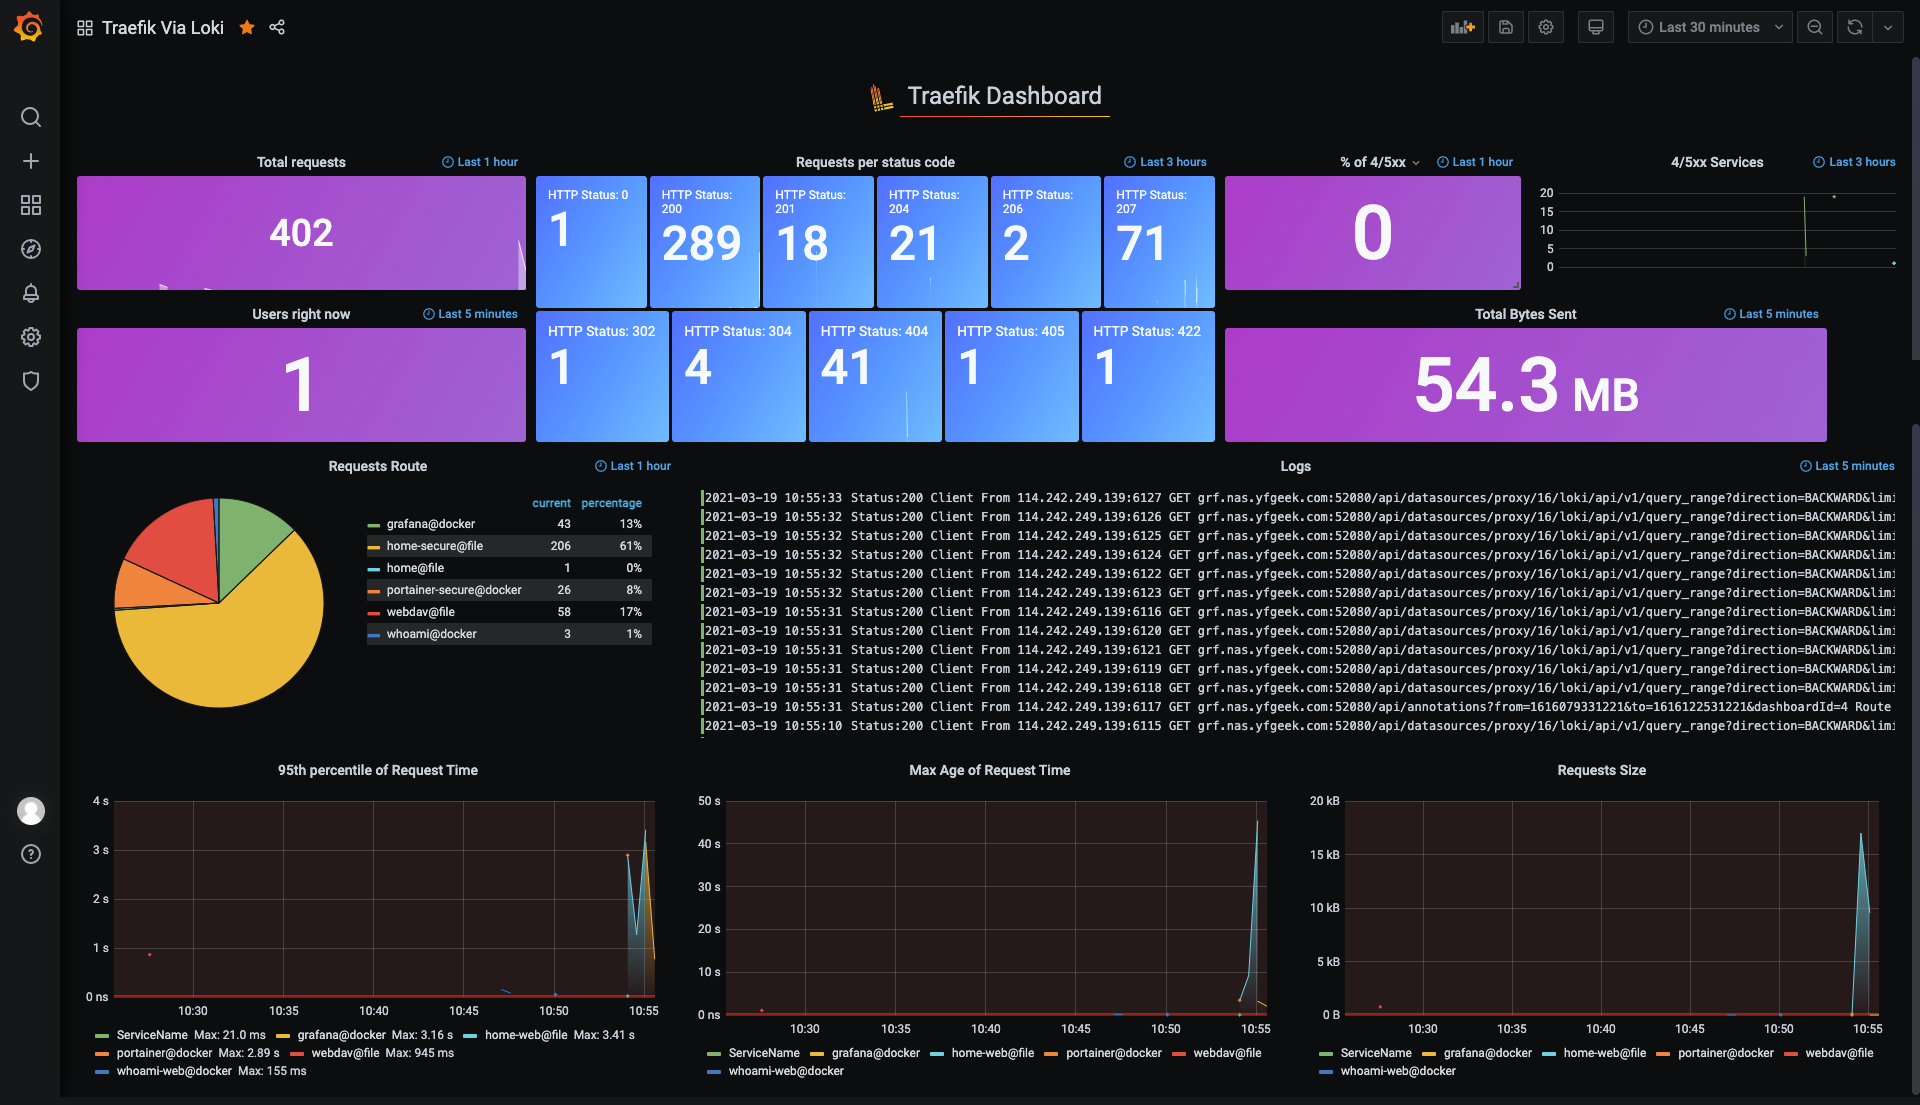
Loki 大盘
因为我在Promtail过程中更改了默认的job名字,可根据ID 13713导入后,手动更改配置,也可以直接通过JSON导入。点击加号按钮,点击Import,通过如下JSON导入:
{"annotations":{"list":[{"builtIn":1,"datasource":"-- Grafana --","enable":true,"hide":true,"iconColor":"rgba(0, 211, 255, 1)","name":"Annotations & Alerts","type":"dashboard"}]},"description":"Loki version 2 showcase using JSON Traefik access logs.","editable":true,"gnetId":13713,"graphTooltip":0,"id":4,"links":[],"panels":[{"datasource":"Loki","description":"","fieldConfig":{"defaults":{"custom":{},"thresholds":{"mode":"absolute","steps":[]}},"overrides":[]},"gridPos":{"h":2,"w":24,"x":0,"y":0},"id":32,"interval":"","options":{"content":"<div class=\"left dashboard-header\">\n <img src=\"https://marketplace-assets.digitalocean.com/logos/loki-logo.svg\" style=\"height:29px;\"/>\n <span>Traefik Dashboard</span>\n</div>","mode":"html"},"pluginVersion":"7.4.3","targets":[{"expr":"loki_build_info","format":"table","instant":false,"interval":"","legendFormat":"","refId":"A"}],"timeFrom":null,"timeShift":null,"title":"","transparent":true,"type":"text"},{"datasource":"Loki","description":"","fieldConfig":{"defaults":{"custom":{},"mappings":[],"thresholds":{"mode":"absolute","steps":[{"color":"purple","value":null}]},"unit":"short"},"overrides":[]},"gridPos":{"h":4,"w":6,"x":0,"y":2},"id":4,"interval":"1m","options":{"colorMode":"background","graphMode":"area","justifyMode":"auto","orientation":"auto","reduceOptions":{"calcs":["sum"],"fields":"","values":false},"text":{},"textMode":"value"},"pluginVersion":"7.4.3","targets":[{"expr":"sum(count_over_time({filename=\"/var/log/access.log\"} |= \"RequestProtocol\" [$__interval]))","legendFormat":"","refId":"A"}],"timeFrom":"1h","timeShift":null,"title":"Total requests ","transformations":[],"transparent":true,"type":"stat"},{"datasource":"Loki","description":"","fieldConfig":{"defaults":{"custom":{},"mappings":[],"thresholds":{"mode":"absolute","steps":[{"color":"light-blue","value":null}]},"unit":"short"},"overrides":[]},"gridPos":{"h":8,"w":9,"x":6,"y":2},"id":5,"interval":"30s","options":{"colorMode":"background","graphMode":"area","justifyMode":"auto","orientation":"auto","reduceOptions":{"calcs":["sum"],"fields":"","values":false},"text":{},"textMode":"auto"},"pluginVersion":"7.4.3","targets":[{"expr":"sum by (OriginStatus) (count_over_time({filename=\"/var/log/access.log\"} |= \"RequestProtocol\" | json | __error__=\"\" [$__interval]))","legendFormat":"HTTP Status: {{OriginStatus}}","refId":"A"}],"timeFrom":"3h","timeShift":null,"title":"Requests per status code","transformations":[],"transparent":true,"type":"stat"},{"cacheTimeout":null,"datasource":"Loki","description":"","fieldConfig":{"defaults":{"custom":{},"mappings":[],"noValue":"0","thresholds":{"mode":"absolute","steps":[{"color":"purple","value":null},{"color":"red","value":80}]},"unit":"percent"},"overrides":[]},"gridPos":{"h":4,"w":4,"x":15,"y":2},"id":19,"interval":"5m","links":[],"maxDataPoints":1,"options":{"colorMode":"background","graphMode":"none","justifyMode":"center","orientation":"auto","reduceOptions":{"calcs":["mean"],"fields":"","values":false},"text":{},"textMode":"value"},"pluginVersion":"7.4.3","targets":[{"expr":" sum(rate({filename=\"/var/log/access.log\"} |~ \"RequestProtocol\" | json | OriginStatus >= 400 |__error__=\"\"[$__interval])) / (sum(rate({job=\"/var/log/traefik.log\"} |~ \"RequestProtocol\" | json | __error__=\"\"[$__interval])) / 100)","legendFormat":"","refId":"A"}],"timeFrom":"1h","timeShift":null,"title":"% of 4/5xx ","transparent":true,"type":"stat"},{"aliasColors":{},"bars":false,"cacheTimeout":null,"dashLength":10,"dashes":false,"datasource":"Loki","description":"","fieldConfig":{"defaults":{"custom":{},"thresholds":{"mode":"absolute","steps":[]},"unit":"none"},"overrides":[]},"fill":1,"fillGradient":0,"gridPos":{"h":4,"w":5,"x":19,"y":2},"hiddenSeries":false,"id":36,"interval":"1m","legend":{"avg":false,"current":false,"hideEmpty":true,"hideZero":true,"max":false,"min":false,"show":false,"total":false,"values":false},"lines":true,"linewidth":1,"links":[],"nullPointMode":"null","options":{"alertThreshold":true},"percentage":false,"pluginVersion":"7.4.3","pointradius":2,"points":false,"renderer":"flot","seriesOverrides":[],"spaceLength":10,"stack":false,"steppedLine":false,"targets":[{"expr":" sum by (OriginStatus,ServiceName) (count_over_time({filename=\"/var/log/access.log\"} |~ \"RequestProtocol\" | json | OriginStatus >= 400 |__error__=\"\"[$__interval]))","legendFormat":" {{ServiceName}} / {{OriginStatus}} ","refId":"A"}],"thresholds":[],"timeFrom":"3h","timeRegions":[],"timeShift":null,"title":" 4/5xx Services","tooltip":{"shared":true,"sort":0,"value_type":"individual"},"transparent":true,"type":"graph","xaxis":{"buckets":null,"mode":"time","name":null,"show":false,"values":[]},"yaxes":[{"$$hashKey":"object:405","decimals":0,"format":"none","label":null,"logBase":1,"max":null,"min":"0","show":true},{"$$hashKey":"object:406","format":"short","label":null,"logBase":1,"max":null,"min":null,"show":false}],"yaxis":{"align":false,"alignLevel":null}},{"datasource":"Loki","description":"","fieldConfig":{"defaults":{"custom":{},"mappings":[],"thresholds":{"mode":"absolute","steps":[{"color":"purple","value":null}]}},"overrides":[]},"gridPos":{"h":4,"w":6,"x":0,"y":6},"id":22,"interval":"5m","options":{"colorMode":"background","graphMode":"none","justifyMode":"auto","orientation":"auto","reduceOptions":{"calcs":["mean"],"fields":"","values":false},"text":{},"textMode":"value"},"pluginVersion":"7.4.3","targets":[{"expr":"count(sum by (ClientHost) (count_over_time({filename=\"/var/log/access.log\"}|= \"RequestProtocol\" | json | __error__=\"\" [$__interval])))","legendFormat":"","refId":"A"}],"timeFrom":"5m","timeShift":null,"title":"Users right now","transformations":[],"transparent":true,"type":"stat"},{"datasource":"Loki","description":"","fieldConfig":{"defaults":{"custom":{},"mappings":[],"thresholds":{"mode":"absolute","steps":[{"color":"purple","value":null}]},"unit":"decbytes"},"overrides":[]},"gridPos":{"h":4,"w":8,"x":15,"y":6},"id":8,"interval":"1m","options":{"colorMode":"background","graphMode":"none","justifyMode":"center","orientation":"auto","reduceOptions":{"calcs":["sum"],"fields":"","values":false},"text":{},"textMode":"value"},"pluginVersion":"7.4.3","targets":[{"expr":"sum_over_time({filename=\"/var/log/access.log\"}|= \"RequestProtocol\" | json | OriginStatus=200 | unwrap DownstreamContentSize | __error__=\"\" [$__interval])","legendFormat":"Bytes sent","refId":"A"}],"timeFrom":"5m","timeShift":null,"title":"Total Bytes Sent","transformations":[{"id":"reduce","options":{"reducers":["sum"]}},{"id":"organize","options":{"excludeByName":{},"indexByName":{},"renameByName":{"Total":"Bytes Sent"}}}],"transparent":true,"type":"stat"},{"aliasColors":{},"breakPoint":"50%","cacheTimeout":null,"combine":{"label":"Others","threshold":0},"datasource":"Loki","description":"","fieldConfig":{"defaults":{"custom":{},"thresholds":{"mode":"absolute","steps":[]}},"overrides":[]},"fontSize":"80%","format":"short","gridPos":{"h":8,"w":8,"x":0,"y":10},"id":33,"interval":"5m","legend":{"percentage":true,"show":true,"values":true},"legendType":"Right side","links":[],"maxDataPoints":3,"nullPointMode":"connected","pieType":"pie","pluginVersion":"7.3.4","strokeWidth":1,"targets":[{"expr":"sum by (RouterName) (count_over_time({filename=\"/var/log/access.log\"}|= \"RequestProtocol\" | json | __error__=\"\" [$__interval]))","legendFormat":"{{RouterName}}","refId":"A"}],"timeFrom":"1h","timeShift":null,"title":"Requests Route","transformations":[],"transparent":true,"type":"grafana-piechart-panel","valueName":"current"},{"datasource":"Loki","fieldConfig":{"defaults":{"custom":{}},"overrides":[]},"gridPos":{"h":8,"w":16,"x":8,"y":10},"id":11,"interval":"","options":{"showLabels":false,"showTime":true,"sortOrder":"Descending","wrapLogMessage":false},"targets":[{"expr":"{filename=\"/var/log/access.log\"} |= \"RequestProtocol\"| json | line_format \"Status:{{.OriginStatus}} Client From {{.ClientAddr}} {{.RequestMethod}} {{.RequestAddr}}{{.RequestPath}} Route To {{.ServiceAddr}}\"","legendFormat":"","refId":"A"}],"timeFrom":"5m","timeShift":null,"title":"Logs","transparent":true,"type":"logs"},{"aliasColors":{"95th percentile":"blue","max latency":"super-light-blue"},"bars":false,"dashLength":10,"dashes":false,"datasource":"Loki","description":"","fieldConfig":{"defaults":{"custom":{},"unit":"ns"},"overrides":[]},"fill":5,"fillGradient":9,"gridPos":{"h":9,"w":8,"x":0,"y":18},"hiddenSeries":false,"id":16,"interval":"30s","legend":{"alignAsTable":false,"avg":false,"current":false,"max":true,"min":false,"rightSide":false,"show":true,"total":false,"values":true},"lines":true,"linewidth":1,"nullPointMode":"null","options":{"alertThreshold":true},"percentage":false,"pluginVersion":"7.4.3","pointradius":2,"points":false,"renderer":"flot","seriesOverrides":[{"$$hashKey":"object:232","alias":"max latency","dashes":true,"fillGradient":3}],"spaceLength":10,"stack":false,"steppedLine":false,"targets":[{"expr":"quantile_over_time(0.95,{filename=\"/var/log/access.log\"} |= \"RequestProtocol\"| json | unwrap Duration | __error__=\"\" [$__interval]) by (ServiceName)","hide":false,"legendFormat":" {{ ServiceName }}","refId":"C"}],"thresholds":[{"$$hashKey":"object:168","colorMode":"critical","fill":true,"line":true,"op":"gt","value":0.3,"yaxis":"left"}],"timeFrom":null,"timeRegions":[],"timeShift":null,"title":"95th percentile of Request Time","tooltip":{"shared":true,"sort":0,"value_type":"individual"},"transparent":true,"type":"graph","xaxis":{"buckets":null,"mode":"time","name":null,"show":true,"values":[]},"yaxes":[{"$$hashKey":"object:178","format":"ns","label":null,"logBase":1,"max":null,"min":null,"show":true},{"$$hashKey":"object:179","format":"short","label":null,"logBase":1,"max":null,"min":null,"show":false}],"yaxis":{"align":false,"alignLevel":null}},{"aliasColors":{"95th percentile":"blue","max latency":"super-light-blue"},"bars":false,"dashLength":10,"dashes":false,"datasource":"Loki","description":"","fieldConfig":{"defaults":{"custom":{},"unit":"ns"},"overrides":[]},"fill":5,"fillGradient":9,"gridPos":{"h":9,"w":8,"x":8,"y":18},"hiddenSeries":false,"id":34,"interval":"30s","legend":{"alignAsTable":false,"avg":false,"current":false,"max":false,"min":false,"rightSide":false,"show":true,"total":false,"values":false},"lines":true,"linewidth":1,"nullPointMode":"null","options":{"alertThreshold":true},"percentage":false,"pluginVersion":"7.4.3","pointradius":2,"points":false,"renderer":"flot","seriesOverrides":[{"$$hashKey":"object:232","alias":"max latency","dashes":true,"fillGradient":3}],"spaceLength":10,"stack":false,"steppedLine":false,"targets":[{"expr":"max by (ServiceName) (max_over_time({filename=\"/var/log/access.log\"} |= \"RequestProtocol\" |json | unwrap Duration | __error__=\"\" [$__interval]))","hide":false,"legendFormat":"{{ ServiceName}}","refId":"D"}],"thresholds":[{"$$hashKey":"object:168","colorMode":"critical","fill":true,"line":true,"op":"gt","value":0.3,"yaxis":"left"}],"timeFrom":null,"timeRegions":[],"timeShift":null,"title":"Max Age of Request Time","tooltip":{"shared":true,"sort":0,"value_type":"individual"},"transparent":true,"type":"graph","xaxis":{"buckets":null,"mode":"time","name":null,"show":true,"values":[]},"yaxes":[{"$$hashKey":"object:178","format":"ns","label":null,"logBase":1,"max":null,"min":null,"show":true},{"$$hashKey":"object:179","format":"short","label":null,"logBase":1,"max":null,"min":null,"show":false}],"yaxis":{"align":false,"alignLevel":null}},{"aliasColors":{"95th percentile":"blue","max latency":"super-light-blue"},"bars":false,"dashLength":10,"dashes":false,"datasource":"Loki","description":"","fieldConfig":{"defaults":{"custom":{},"unit":"decbytes"},"overrides":[]},"fill":5,"fillGradient":9,"gridPos":{"h":9,"w":8,"x":16,"y":18},"hiddenSeries":false,"id":35,"interval":"30s","legend":{"alignAsTable":false,"avg":false,"current":false,"max":false,"min":false,"rightSide":false,"show":true,"total":false,"values":false},"lines":true,"linewidth":1,"nullPointMode":"null","options":{"alertThreshold":true},"percentage":false,"pluginVersion":"7.4.3","pointradius":2,"points":false,"renderer":"flot","seriesOverrides":[{"$$hashKey":"object:232","alias":"max latency","dashes":true,"fillGradient":3}],"spaceLength":10,"stack":false,"steppedLine":false,"targets":[{"expr":"sum by (ServiceName) (sum_over_time({filename=\"/var/log/access.log\"} |= \"RequestProtocol\" |json | unwrap RequestContentSize | __error__=\"\" [$__interval]))","hide":false,"legendFormat":"{{ ServiceName}}","refId":"D"}],"thresholds":[{"$$hashKey":"object:168","colorMode":"critical","fill":true,"line":true,"op":"gt","value":0.3,"yaxis":"left"}],"timeFrom":null,"timeRegions":[],"timeShift":null,"title":"Requests Size","tooltip":{"shared":true,"sort":0,"value_type":"individual"},"transparent":true,"type":"graph","xaxis":{"buckets":null,"mode":"time","name":null,"show":true,"values":[]},"yaxes":[{"$$hashKey":"object:178","format":"decbytes","label":null,"logBase":1,"max":null,"min":null,"show":true},{"$$hashKey":"object:179","format":"short","label":null,"logBase":1,"max":null,"min":null,"show":false}],"yaxis":{"align":false,"alignLevel":null}}],"refresh":false,"schemaVersion":27,"style":"dark","tags":[],"templating":{"list":[]},"time":{"from":"now-1h","to":"now"},"timepicker":{"refresh_intervals":["10s","30s","1m","5m","15m","30m","1h","2h","1d"]},"timezone":"","title":"Traefik Via Loki","uid":"fJarCeaGk","version":2}
到这里,两个大盘就完美展示了,具体Grafana如何使用可自行查阅资料。
值得注意的是,后续增加容器服务,只要注册在Traefik,就会自动联动到监控系统,无需任何二次配置,实现简单,便捷,统一管理。
本文所涉及的文件均在此处可找到:https://github.com/yfgeek/traefik-docker-compose